Three weeks into a semester, Canvas tells you you have a 100% in a course. You have handed in one syllabus quiz. Both of those facts are true at the same time, and the gap between them is where a lot of bad planning starts.
Canvas computes your grade from work that has been graded. That is the correct thing for it to do — it cannot mark a paper you have not written — but it means the percentage it shows answers a much narrower question than the one you are asking. You want to know how the course is going to end. It is telling you how the graded slice went.
The number that is actually missing
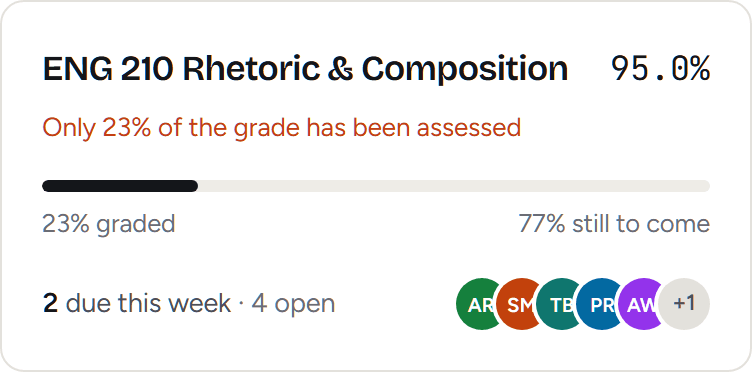
What matters alongside the percentage is how much of the final grade it covers. Call it the assessed share. A 100% covering 4% of the grade and a 100% covering 85% of the grade are the same number describing completely different situations.
| Course | Canvas says | Assessed | Worst you can finish |
|---|---|---|---|
| Intro Bio | 100% | 4% | 4% |
| Rhetoric | 100% | 85% | 85% |
In the first course, a perfect record so far protects you from essentially nothing — 96% of the grade has not happened. In the second, the same percentage means the course is effectively over and went well. Canvas prints the same two characters for both.
Why it skews high specifically
It is not random which direction the early number is wrong in. Three things push it upward.
Easy things get graded first. Syllabus quizzes, attendance marks and introduction posts are designed for everyone to pass. They are also the first things in the gradebook, so the opening percentage is drawn entirely from the least representative work in the course.
Ungraded work counts as nothing, not as zero. An assignment you never submitted often sits ungraded for weeks before an instructor enters the zero. Until they do, it is invisible to the calculation — your grade is not being docked, it is simply not being told.
The heavy work is at the end. Finals, portfolios and projects usually carry the largest weights and land last. The part of your grade with the most leverage is the part Canvas knows least about for most of the semester.
How to read it properly
Two questions turn the number back into something useful.
How much of the grade has been decided? In Canvas, open the course, go to Assignments and switch to the assignment-groups view. If the course uses weighting, each group shows its percentage. Add up the weight of the groups where everything has been graded. That is roughly your assessed share.
What is the worst I can finish with? Multiply your current percentage by your assessed share. If you are at 100% with 4% assessed, the floor is 4% — you are one bad semester from failing regardless of how the gradebook looks today. That number is far more informative than the headline.
The trap this creates
The practical damage is not that the number is wrong. It is that people plan around it. A course showing 100% gets deprioritised in favour of the one showing 78%, when the 78% may be nearly settled and the 100% almost entirely undecided. You end up spending your effort on the course where it can change the least.
Ranking your courses by how much of the grade is still in play — rather than by the percentage — usually reverses the order you would have picked.
Related
Weighted categories are what make the assessed share uneven in the first place — how weighted assignment groups work covers where to find your real weights.